
Structured data for investment research is the organized, machine-readable information model that enables analysts to automate valuation, run reproducible risk models, and audit every claim back to its source. The industry term is structured financial data, and it covers everything from XBRL-tagged SEC filings to OHLCV price series to FRED macroeconomic indicators. Platforms like Orbit and frameworks like the Model Context Protocol (MCP) have made it possible to ingest dozens of these sources in a single pipeline run. The payoff is real: faster analysis, fewer manual errors, and research that can defend itself in front of a compliance team.
What are the primary sources of structured data for investment research?
Investment research analytics draws from four distinct data layers. Each layer answers a different question, and serious pipelines pull from all four simultaneously.
Regulatory and fundamental filings are the bedrock. SEC EDGAR delivers XBRL-tagged financial statements for every public U.S. company. XBRL forces consistent field definitions across filers, which makes cross-company comparisons machine-readable by default. This is the cleanest structured financial data available to analysts at no cost.

Market data covers price, volume, and derived metrics. Providers like Polygon.io and Yahoo Finance deliver OHLCV (open, high, low, close, volume) series with standardized timestamps. These feeds slot directly into quantitative models without transformation overhead.
Macroeconomic datasets from FRED (Federal Reserve Economic Data), the World Bank, and the OECD supply the context layer. GDP growth, unemployment rates, yield curves, and credit spreads all arrive in consistent, versioned formats. Analysts who skip this layer often miss the macro regime shifts that invalidate sector-level assumptions.
Alternative and specialized sources include:
- Patent grant records (USPTO) for R&D pipeline signals
- Insider trading disclosures (SEC Form 4) for management conviction signals
- Consumer sentiment indices (University of Michigan, Conference Board)
- Earnings call transcripts and investor relations materials for qualitative signals
High-scale platforms now consolidate access to 13 or more of these source categories in parallel, returning scored JSON responses that investment agents can reason over directly. That architecture collapses what used to be a week of data wrangling into a single API call.
How do leading platforms implement structured data pipelines?
The shift from spreadsheet-based research to agentic pipelines is not theoretical. Several production platforms demonstrate exactly how structured data feeds into automated research workflows today.
Orbit operates at a scale that changes what "comprehensive" means. Orbit processes over 70 million financial documents annually from more than 71,000 companies, with modular API pricing starting at $0.045 per multi-source query. That price point makes it viable to run full-coverage scans on entire sectors, not just a watchlist.
FinResearchAgent (from the Schadenfreunde GitHub repository) demonstrates the agentic pattern clearly. Equity research workflows in this pipeline pre-fetch 22 structured data sources per run, including XBRL filings and FRED indicators, before any language model touches the data. Ingesting validated structured data before AI interaction is the correct order of operations. It reduces hallucinations because the model reasons over facts, not its own priors.
ContoursAI addresses the compliance problem directly. Audit-ready platforms cite every claim to its original, licensed source at the paragraph level. That granularity matters when a portfolio manager needs to defend a thesis to a risk committee or a regulator.
Quartr Pro solves the qualitative layer. The platform uses MCP to pipe live financial documents directly into AI models, turning static investor relations portals into queryable live feeds. The constraint is intentional: the system sources only licensed first-party IR materials, not web-scraped content, to preserve signal quality.
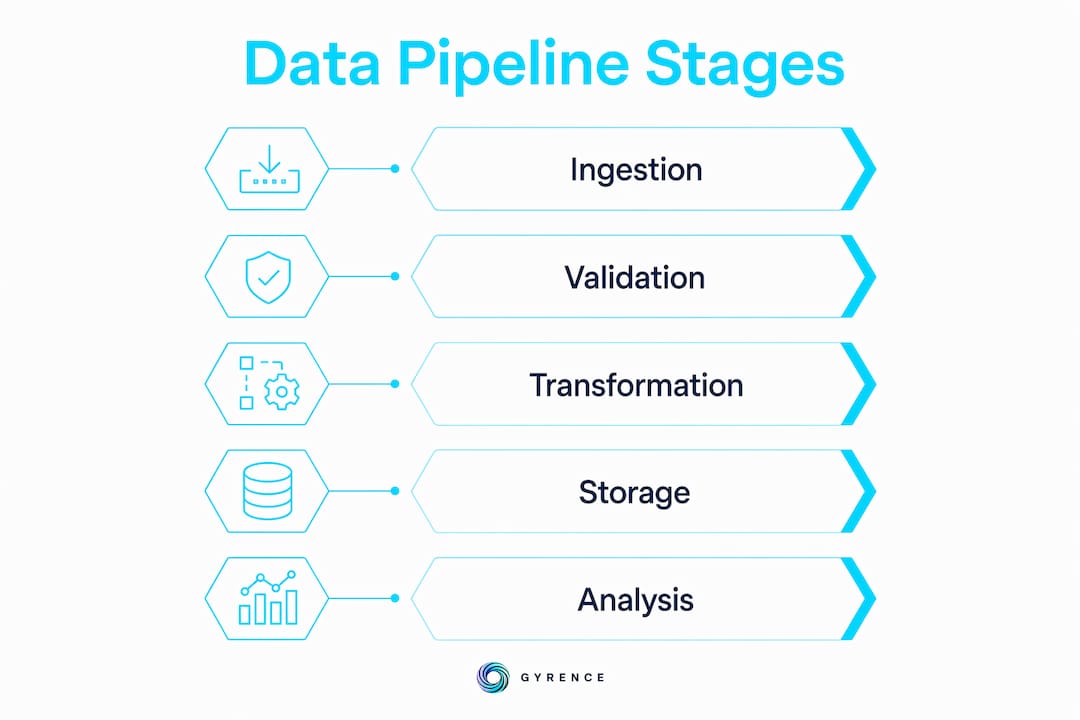
The numbered workflow that most production pipelines follow looks like this:
- Fetch structured sources (XBRL, OHLCV, FRED, alternative data) via typed API calls
- Normalize and align schemas using a master data management layer
- Pipe clean, labeled data into the AI model via MCP or a Python-first ingestion layer
- Generate synthesis with paragraph-level source citations
- Output audit-ready reports with traceable evidence chains
Pro Tip: Run your data ingestion step as a separate, logged process before any LLM call. If the model produces a wrong answer, you need to know whether the failure was in the data or the reasoning. Mixing the two steps makes that diagnosis impossible.
Structured data services: how do the top providers compare?
Choosing the right data structure for finance work depends on coverage, latency, pricing model, and how well the output fits your downstream tooling. The table below maps the key dimensions.
| Provider | Coverage | Pricing Model | Best Fit |
|---|---|---|---|
| Orbit | 71,000+ companies, 70M docs/year | $0.045 per multi-source query | Broad fundamental and alternative data at scale |
| Polygon.io | Real-time and historical OHLCV | Subscription tiers by data type | Quantitative and algorithmic strategies |
| FRED (St. Louis Fed) | 800,000+ macroeconomic series | Free, API-accessible | Macro overlay and regime analysis |
| Quartr Pro | First-party IR materials, earnings calls | Subscription | Qualitative signal extraction from management commentary |
| Investment Alt Data MCP | 13 source categories, scored JSON | Usage-based | Agentic pipelines needing parallel source synthesis |
On the technical side, time-series databases built in C++ offer a meaningful edge for high-frequency data. As-of join operations with O(n log m) complexity outperform standard relational databases for point-in-time market data queries. That matters when you are backtesting a strategy across a decade of tick data and cannot afford look-ahead bias from a naive join.
Qualitative data extraction is the dimension most providers underserve. AI research systems that source exclusively from clean, internal IR data extract management commentary signals that web-scraped alternatives miss entirely. The noise floor from public web content is simply too high for reliable sentiment analysis on earnings calls.
Pro Tip: When evaluating a data provider, ask for their schema change log. Providers who version their field definitions and publish breaking changes are the ones whose data you can trust in a production model. Providers who don't are a liability.
Best practices for using structured financial data in research
Getting structured data into your pipeline is the easy part. Using it without introducing silent errors requires discipline at every layer.
Master Data Management (MDM) is non-negotiable. MDM ensures identical definitions across balance sheets, income statements, and CRM systems. Without it, "revenue" in one dataset means gross revenue and in another means net revenue after returns. That discrepancy does not announce itself. It just makes your model wrong.
Schema alignment deserves more time than model architecture. Financial data labeling and schema alignment are where AI model reliability is actually won or lost. Analysts who spend more time on consistent field definitions than on model tuning consistently produce more defensible outputs.
Best practices for financial data analysis workflows include:
- Maintain a data dictionary that defines every field, its source, and its transformation history
- Use point-in-time snapshots to prevent look-ahead bias in backtests
- Validate schema consistency every time a provider updates their API
- Separate raw ingestion from transformed features in your data pipeline
- Log every data pull with timestamps and source versions for audit trails
Audit readiness is a first-class requirement, not an afterthought. The primary bottleneck in investment research is verified evidence synthesis, not data access. Any platform that cannot trace a claim back to its licensed source at the paragraph level creates compliance exposure. Build that traceability into your pipeline from day one, not during a regulatory review.
Combining structured data with unstructured sources requires care. Earnings call transcripts and management commentary carry real signal, but only when sourced from licensed first-party materials. Web-scraped versions introduce noise from third-party summaries, paraphrases, and errors. The signal degrades faster than most analysts realize.
Pro Tip: Build a "data freshness" check into every pipeline run. Stale FRED data or a missed XBRL filing update can silently invalidate a model. Automate the check so it fails loudly rather than producing subtly wrong outputs.
Key takeaways
Reliable structured financial data requires consistent schema definitions, audit-ready source tracing, and agentic pipelines that ingest validated data before any AI model interaction.
| Point | Details |
|---|---|
| Ingest before reasoning | Feed structured, validated data into AI models before LLM interaction to reduce hallucinations. |
| MDM prevents silent errors | Master Data Management aligns field definitions across sources so "revenue" means the same thing everywhere. |
| Audit trails are mandatory | Paragraph-level source citations protect analysts during compliance reviews and client scrutiny. |
| Scale matters for coverage | Platforms like Orbit processing 70M+ documents annually provide breadth that manual research cannot match. |
| Time-series databases outperform SQL | C++ time-series engines with as-of joins handle point-in-time market data queries faster and more accurately. |
The shift i keep watching in investment data infrastructure
The most significant change I have observed over the past few years is not a new data source. It is the architectural shift from monolithic research platforms to composable, agentic pipelines. Analysts used to buy one big platform and accept whatever data it bundled. Now the best teams assemble their own stack: a time-series database for market data, a structured extraction layer for filings, a qualitative feed for IR materials, and an MCP endpoint to wire it all into an AI model.
That composability is genuinely powerful. It also creates a new failure mode that I think is underappreciated. When you own the assembly, you own the schema alignment problem. I have seen pipelines that pull from six well-regarded providers and still produce wrong outputs because nobody enforced a consistent definition of "operating income" across all six. The data was clean. The integration was broken.
My honest read on where this goes: the teams that win in 2026 and beyond are not the ones with access to the most data sources. They are the ones who treat data labeling and AI training dataset quality as a core competency, not a vendor's problem. The model is only as trustworthy as the definitions underneath it.
Human oversight is not going away either. Automation handles the volume. Analysts handle the judgment calls about which signals matter in a given market regime. The best pipelines I have seen are designed to surface anomalies for human review, not to replace the analyst's contextual reasoning.
— Glen
How Gyrence fits into your data pipeline
Gyrence is built for exactly the kind of structured data ingestion that investment research pipelines require. Its five composable primitives, Search, Traverse, Fetch, Extract, and Map, let you pull web-sourced financial data into typed, agent-ready JSON without writing custom scrapers for every source. Every call returns a discriminated-union response that includes failure cases, so your pipeline fails loudly instead of silently passing bad data downstream. Spending caps mean your data bill stays predictable even when an agent runs at scale. If you are building or auditing a financial data pipeline, explore Gyrence's infrastructure to see how it handles the ingestion layer cleanly.
FAQ
What is structured data in investment research?
Structured data in investment research is financial information organized into consistent, machine-readable formats such as XBRL-tagged SEC filings, OHLCV price series, and standardized macroeconomic datasets. This format enables automated analysis, reproducible models, and audit-ready reporting.
Which platforms provide the best structured financial data coverage?
Orbit covers 71,000+ companies and processes over 70 million documents annually, making it one of the broadest sources for fundamental and alternative data. Polygon.io and FRED complement it with real-time market data and macroeconomic series respectively.
Why does data ingestion need to happen before AI model interaction?
Python-first ingestion pipelines that validate structured data before passing it to a language model reduce hallucinations because the model reasons over verified facts rather than its own training priors. Mixing ingestion and reasoning in the same step makes errors harder to diagnose.
What is master data management and why does it matter for analysts?
Master Data Management (MDM) enforces consistent field definitions, such as a single definition of "revenue," across all data sources in a pipeline. Without MDM, semantic inconsistency silently corrupts model outputs and analyst conclusions.
How does the model context protocol improve investment research workflows?
MCP pipes live financial documents directly into AI models, turning static investor relations portals into queryable data feeds. This enables dynamic, real-time research without manual document retrieval between each query cycle.